


SSC Foundation Eklavya - 1 Offline Cum Online Batch Lucknow Branch
27 July, 2026


Enter your Email ID and we'll send you a link to get back into your account.

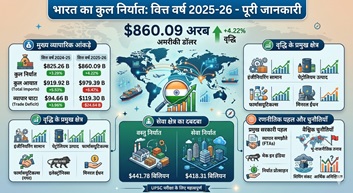

India’s Total Exports in FY 2025–26
Wed 15 Apr, 2026
Context :
Key Trade Figures (At a Glance) :
Major Export Drivers :
Petroleum Products :
➡ Improvement in global energy demand and prices boosted petroleum exports.
Engineering Goods :
➡ Though modest, this growth reflects India’s engineering strength and stable global demand.
Mica, Coal & Other Ores :
➡ Significant rise indicates strong competitiveness of India’s natural resources.
Other Cereals :
➡ Exceptional growth driven by rising global demand and new agricultural export opportunities.
Handicrafts (excluding carpets) :
➡ Reflects increasing global demand for Indian traditional crafts.
Export Destinations (Growth Trends) :
India’s Major Free Trade Agreements (FTAs) :
India currently has 9 FTAs covering more than 38 countries, with accelerated momentum in recent years:
| Agreement (FTA/CEPA) | Partner | Status (Signed/Implemented) | Key Benefits for India |
| India-UAE CEPA | United Arab Emirates | May 2022 (In force) | Strong export growth in petroleum, gems & jewellery, agriculture |
| India-Australia ECTA | Australia | December 2022 (In force) | Minerals, education services, engineering |
| India-EFTA TEPA | Switzerland, Iceland, Norway, Liechtenstein | October 2025 (In force) | $100 billion investment commitment, 1 million jobs |
| India-UK CETA | United Kingdom | Signed July 2025, expected May 2026 | 99% duty-free access (textiles, leather, jewellery) |
| India-Oman CEPA | Oman | Signed Dec 2025, expected June 2026 | Better Gulf access, energy & logistics |
| India-New Zealand FTA | New Zealand | Expected April 2026, implementation Oct 2026 | Agriculture, dairy, tourism services |
| India-EU FTA | European Union | Negotiations concluded Jan 2026, ratification pending | Duty-free access for 90%+ exports (textiles, seafood, jewellery) |
| Existing Agreements | ASEAN, Japan, South Korea, Singapore, Mauritius | Already in force | Regional & bilateral market access |
27 July, 2026
22 July, 2026
20 July, 2026
26 May, 2026
08 May, 2026
20 April, 2026
01 April, 2026
01 April, 2026
16 March, 2026
15 March, 2026
